
How RuutIQ works?
RuutIQ is built to power every step of modern distribution from planning to delivery by eliminating silos and simplifying decision-making. Whether it's syncing frontline activity with backend systems or delivering real-time visibility, RuutIQ ensures that every moment in your sales and operations journey is connected, responsive, and intelligent.

Connect
Syncs with ERP, CRM, and inventory systems.
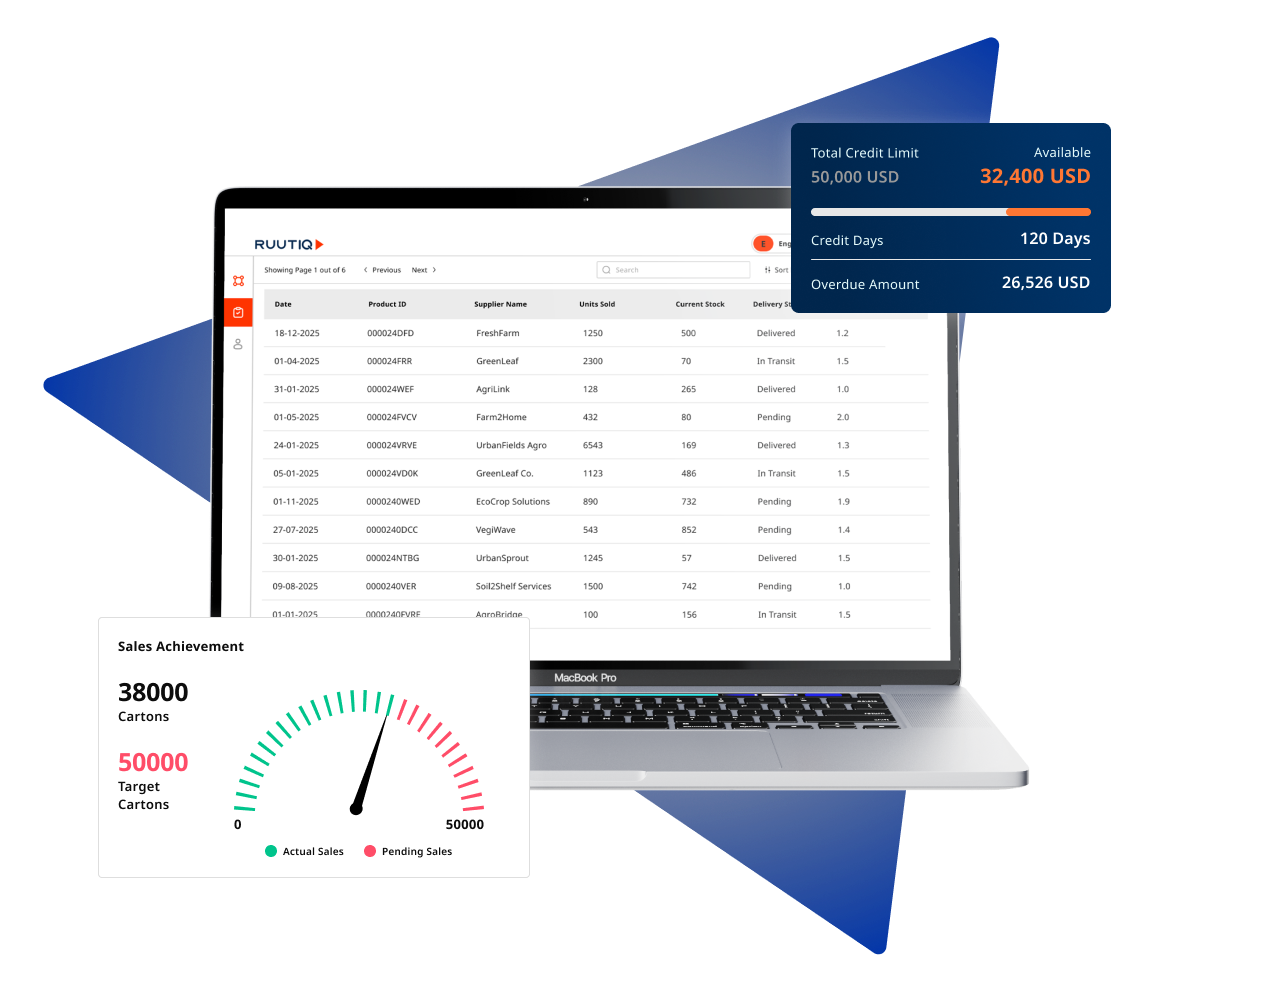
Bridge your core business systems to create a unified digital backbone, linking data from sales, inventory, finance, and supply chain into one platform.

Plan
AI-optimised routes and schedules
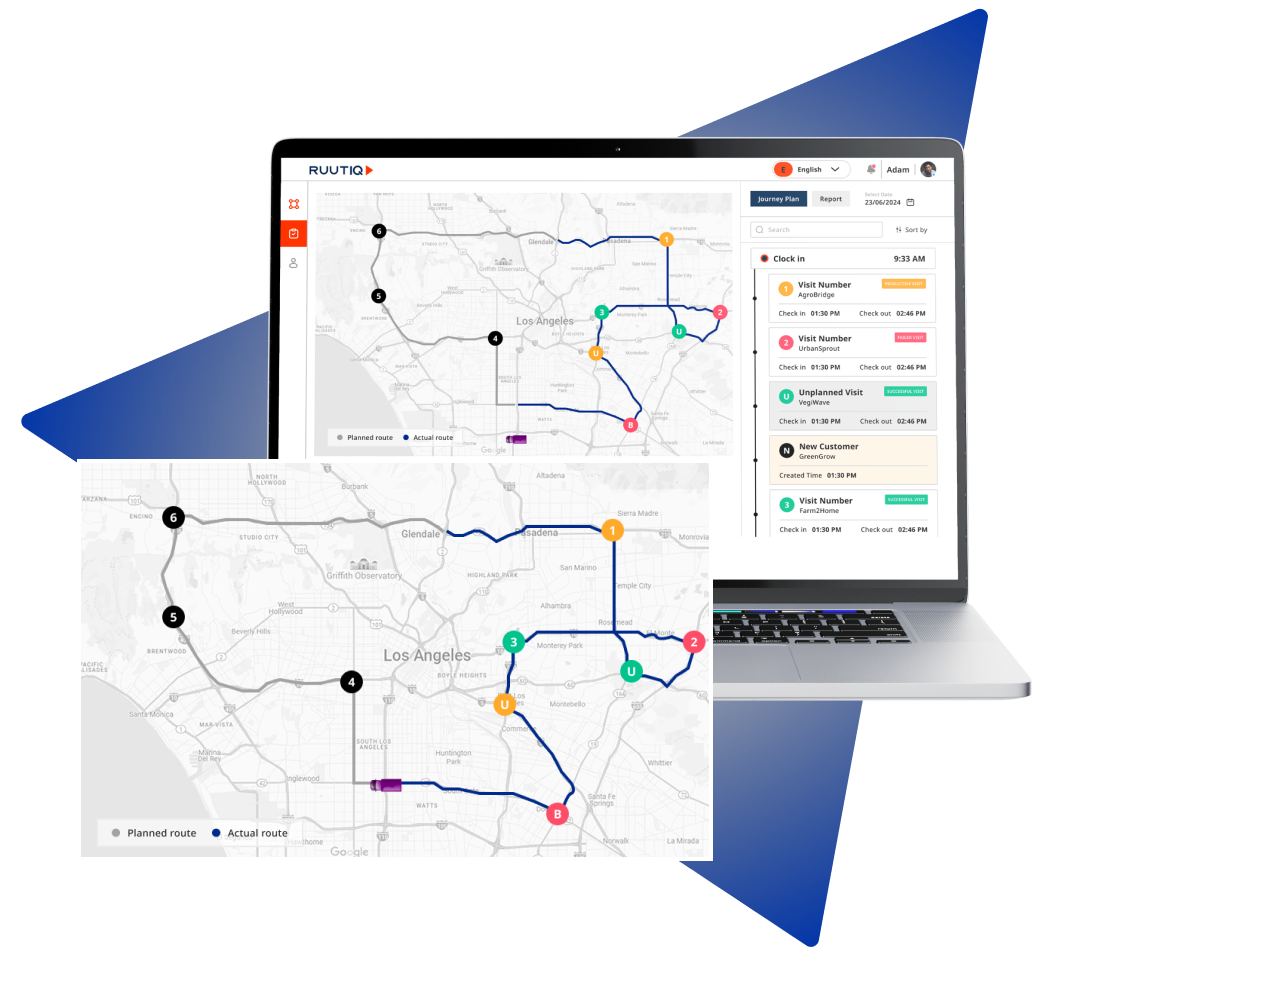
Generates efficient, field-ready delivery and sales schedules by adapting to traffic, inventory status, and customer priorities in real time.
Execute
Field teams manage orders, collections, and deliveries
Mobilizes your field force with smart tools to handle everything from pre-sales orders to doorstep deliveries, boosting accuracy and reducing turnaround times.

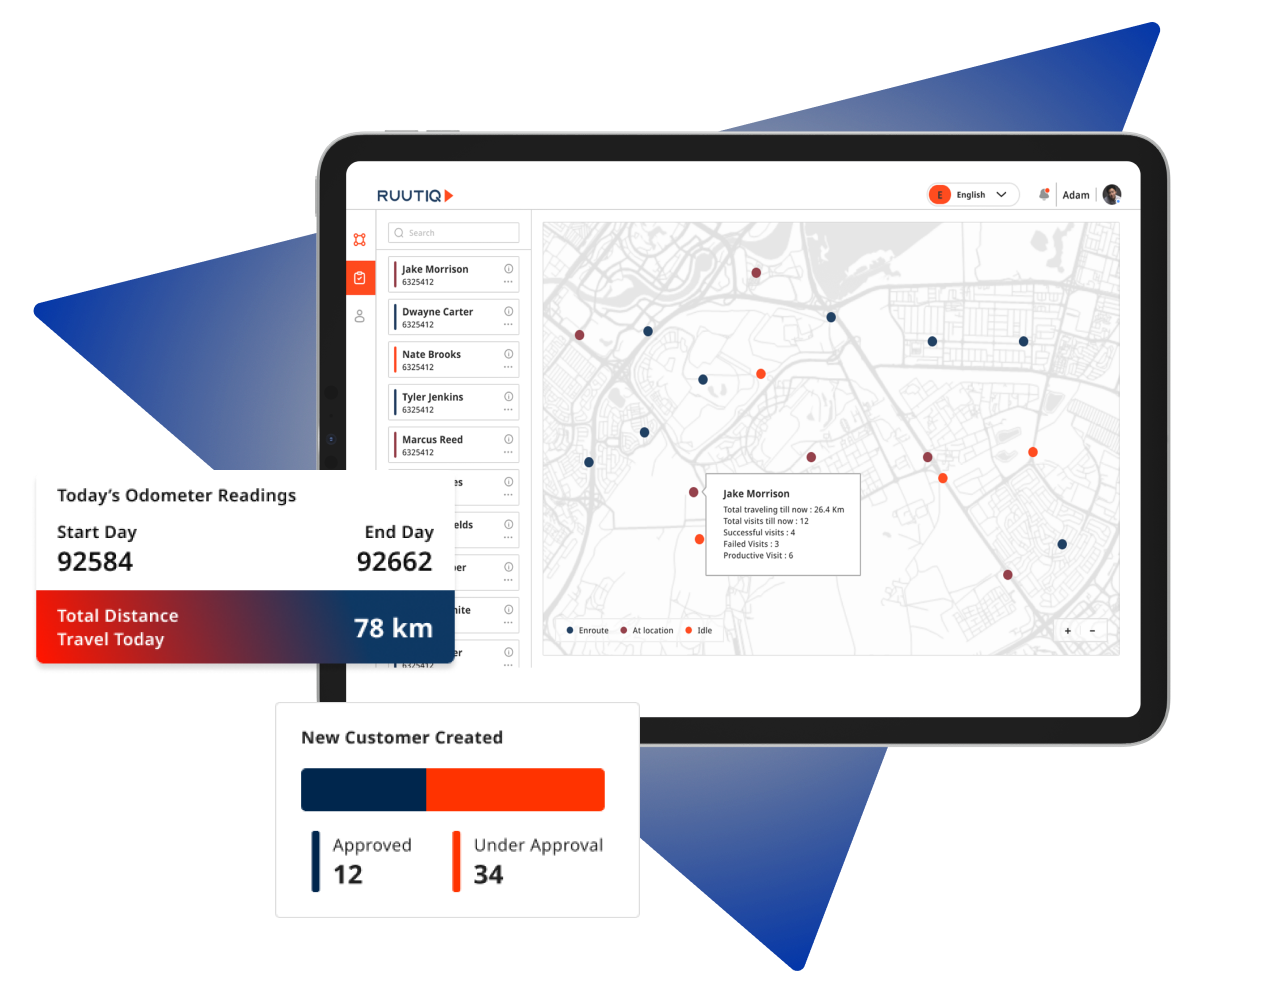
Track
Real-time monitoring of reps, tasks, and KPIs
Keeps your finger on the pulse with live updates on team locations, delivery progress, and compliance benchmarks, all visible from a single dashboard.
Optimize
Data-driven insights for better performance
Analyzes operational trends and performance metrics to identify gaps, streamline workflows, and support smarter and faster business decisions.
